|
The Oliver and Holbrook (Journal Atmospheric and Oceanic Technology, 2014) (pdf), or OH14, data set provides spatially and temporally homogeneous measurements of sea surface temperature (SST) variability at high resolution on the continental shelf around Australia.
- The data arises from a hybrid statistical-physical downscaling model designed to more accurately and robustly represent SST on the continental shelf informed by large-scale satellite observations and reanalysis data. The downscaled shelf SST is modeled using: (i) offshore SST from Bluelink ReANalysis (BRAN), (ii) the statistical relationship between inshore and offshore SST in observations from the Advanced Very High Resolution Radiometer (AVHRR), and (iii) the mean circulation which provides connectivity information between the shelf and the offshore regions. The SST time series' were separated into the mean, seasonal cycle, and the residual variability, and separate models were developed for each component.
- The data are provided as a single NetCDF file, along with a User's Manual and MATLAB script for loading the data: download data
- A comparison of sea surface temperature time series from the OH14 data set against observations (AVHRR) and BRAN is shown below for two locations:
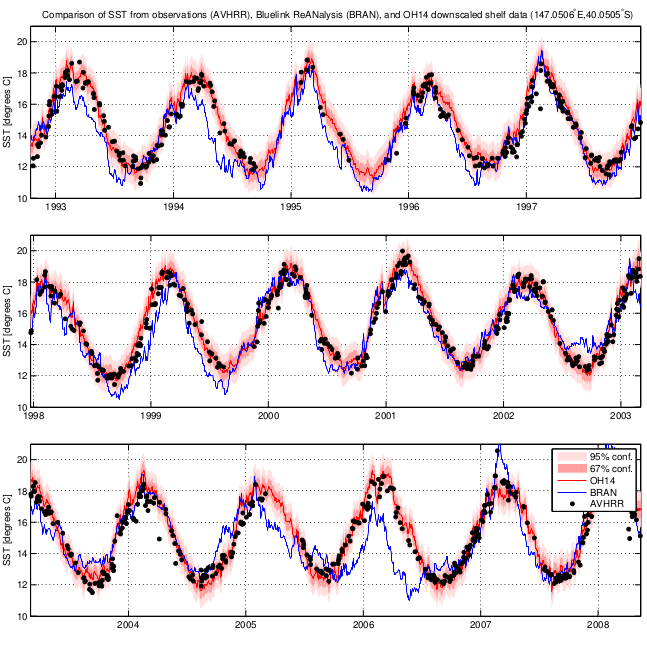
Figure 2: A comparison of sea surface temperature from observations (AVHRR, black dots), Bluelink ReANalysis (BRAN, blue line), and OH14 downscaled data (red line, with 67\% and 95\% confidence limits shown by shaded areas) for a location in Bass Strait.
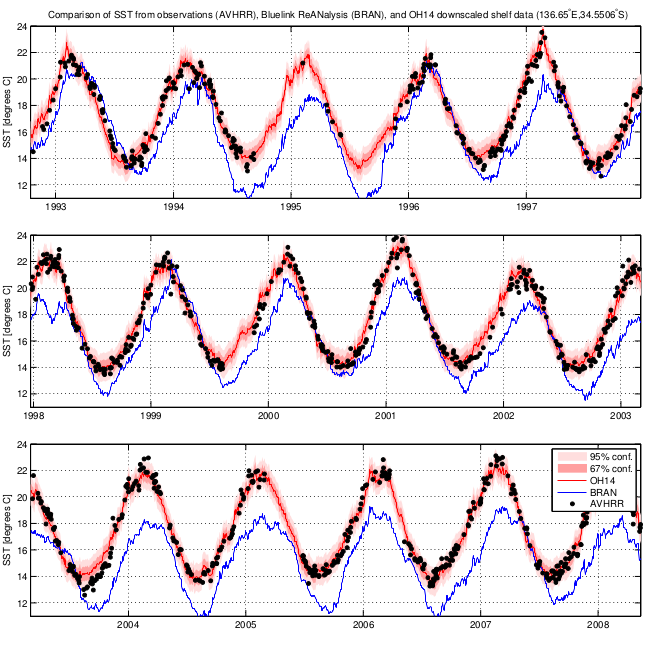
Figure 3: As above, but for a location in Spencer Gulf.
|
