Eric C. J. Oliver
Extreme Surface and Near-Bottom Currents in the Northwest Atlantic
|
Abstract: Oliver et al., Natural Hazards, 2012 presents a methodology for estimating extreme current speeds from numerical model results using extremal analysis techniques. This method is used to estimate the extreme near-surface and near-bottom current speeds of the northwest Atlantic Ocean with 50-year return periods from 17 years of model output. The non-tidal currents produced by a three-dimensional ocean circulation model for the 1988–2004 period were first used to estimate and map the 17-year return period extreme current speeds at the surface and near the bottom. Extremal analysis techniques (i.e., fitting the annual maxima to the Type I probability distribution) are used to estimate and map the 50-year extreme current speeds. Tidal currents are dominant in some parts of the northwest Atlantic, and a Monte Carlo-based methodology is developed to take into account the fact that large non-tidal extrema may occur at different tidal phases. The inclusion of tidal currents in this way modifies the estimated 50-year extreme current speeds, and this is illustrated along several representative transects and depth profiles. Seasonal variations are examined by calculating the extreme current speeds for fall-winter and spring–summer. Finally, the distribution of extreme currents is interpreted taking into account (1) variability about the time-mean current speeds, (2) wind-driven Ekman currents, and (3) flow along isobaths.
- The maps below show the extreme surface and near-bottom currents in the Northwest Atlantic, separated by season:
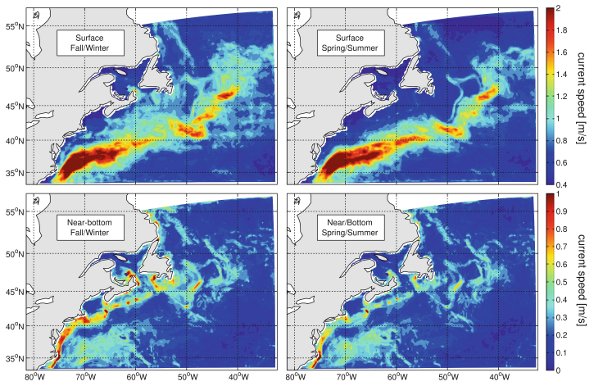
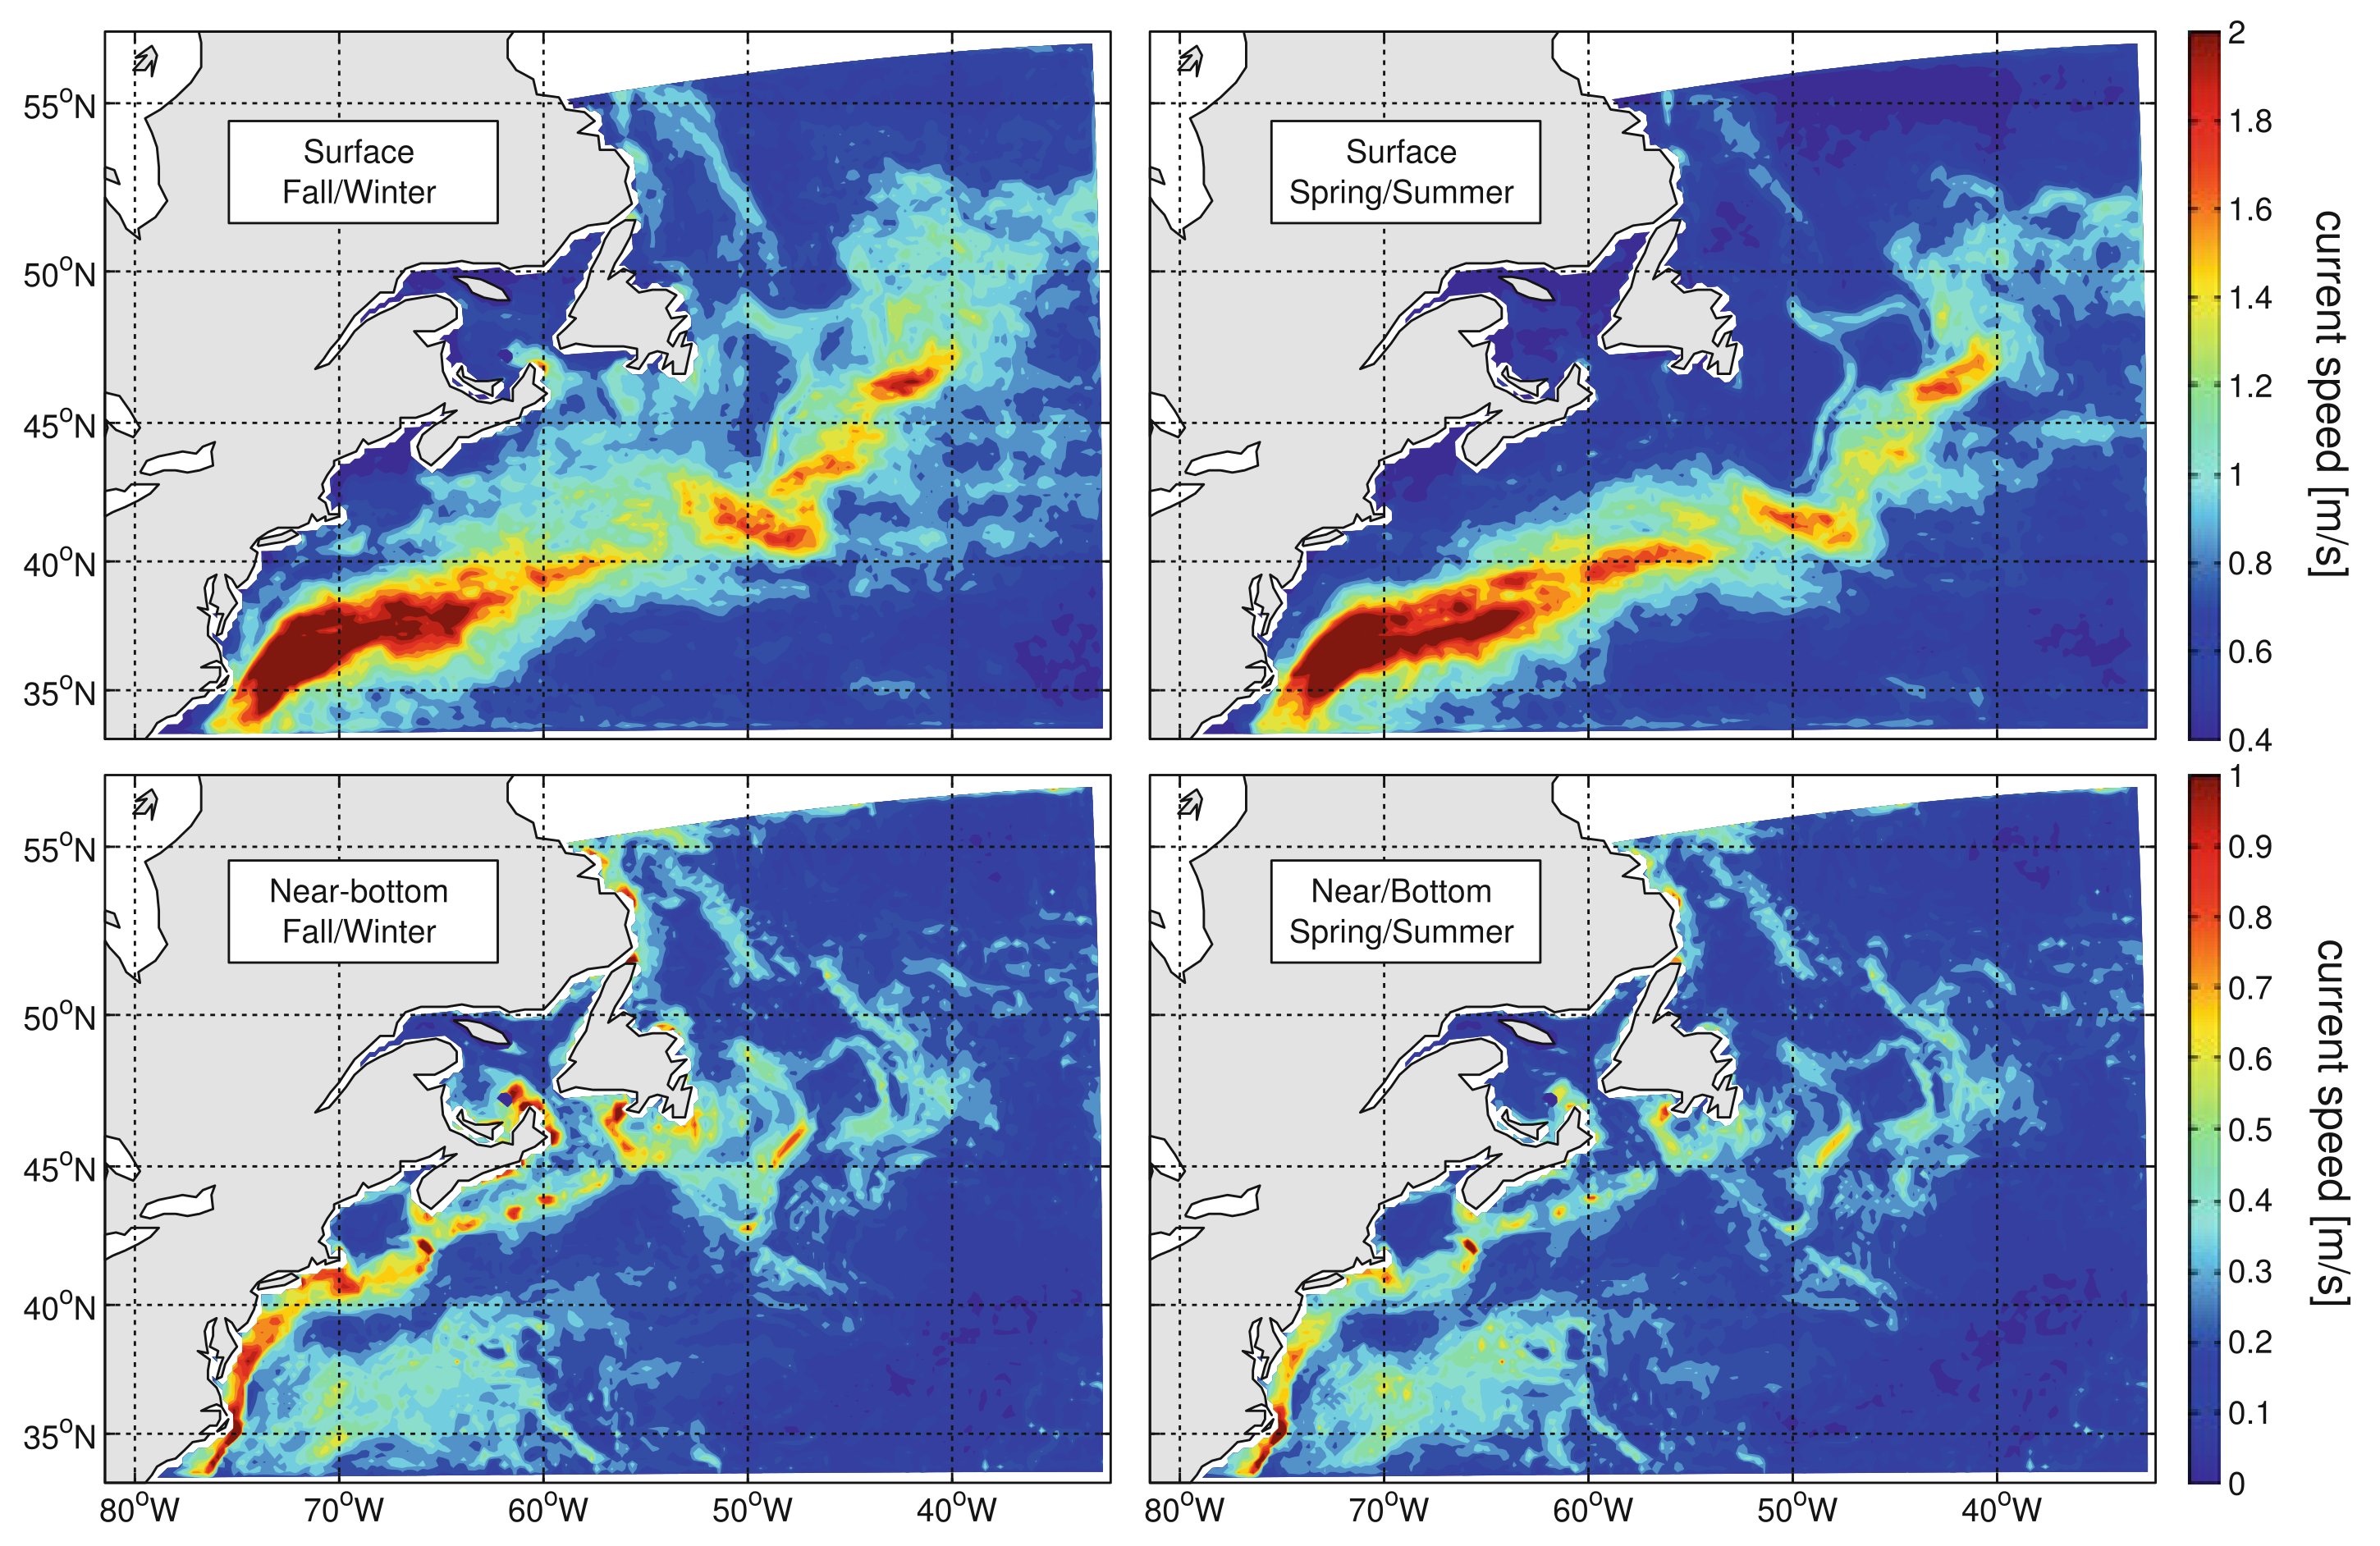
Figure 1: Extreme non-tidal current speeds in the northwest Atlantic with a return period of 50 years. The extreme current speed, estimated from a fit of the non-tidal model current speed annual maxima to the Type I (Gumbel) extreme value distribution, is shown for fall–winter (left panels) and spring–summer (right panels) at the surface (upper panels) and near the bottom (lower panels). (click image for hi-res version.)
- Currents were decomposed into a sum of a tidal component and a non-tidal component, assumed to be independent of each other. A Monte Carlo approach to the Joint Probability Method was developed in order to include the independet influences of the tidal and non-tidal components of current speed:
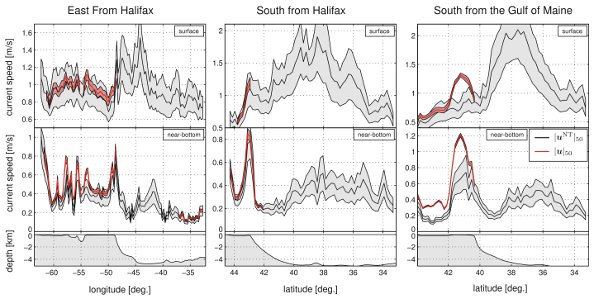
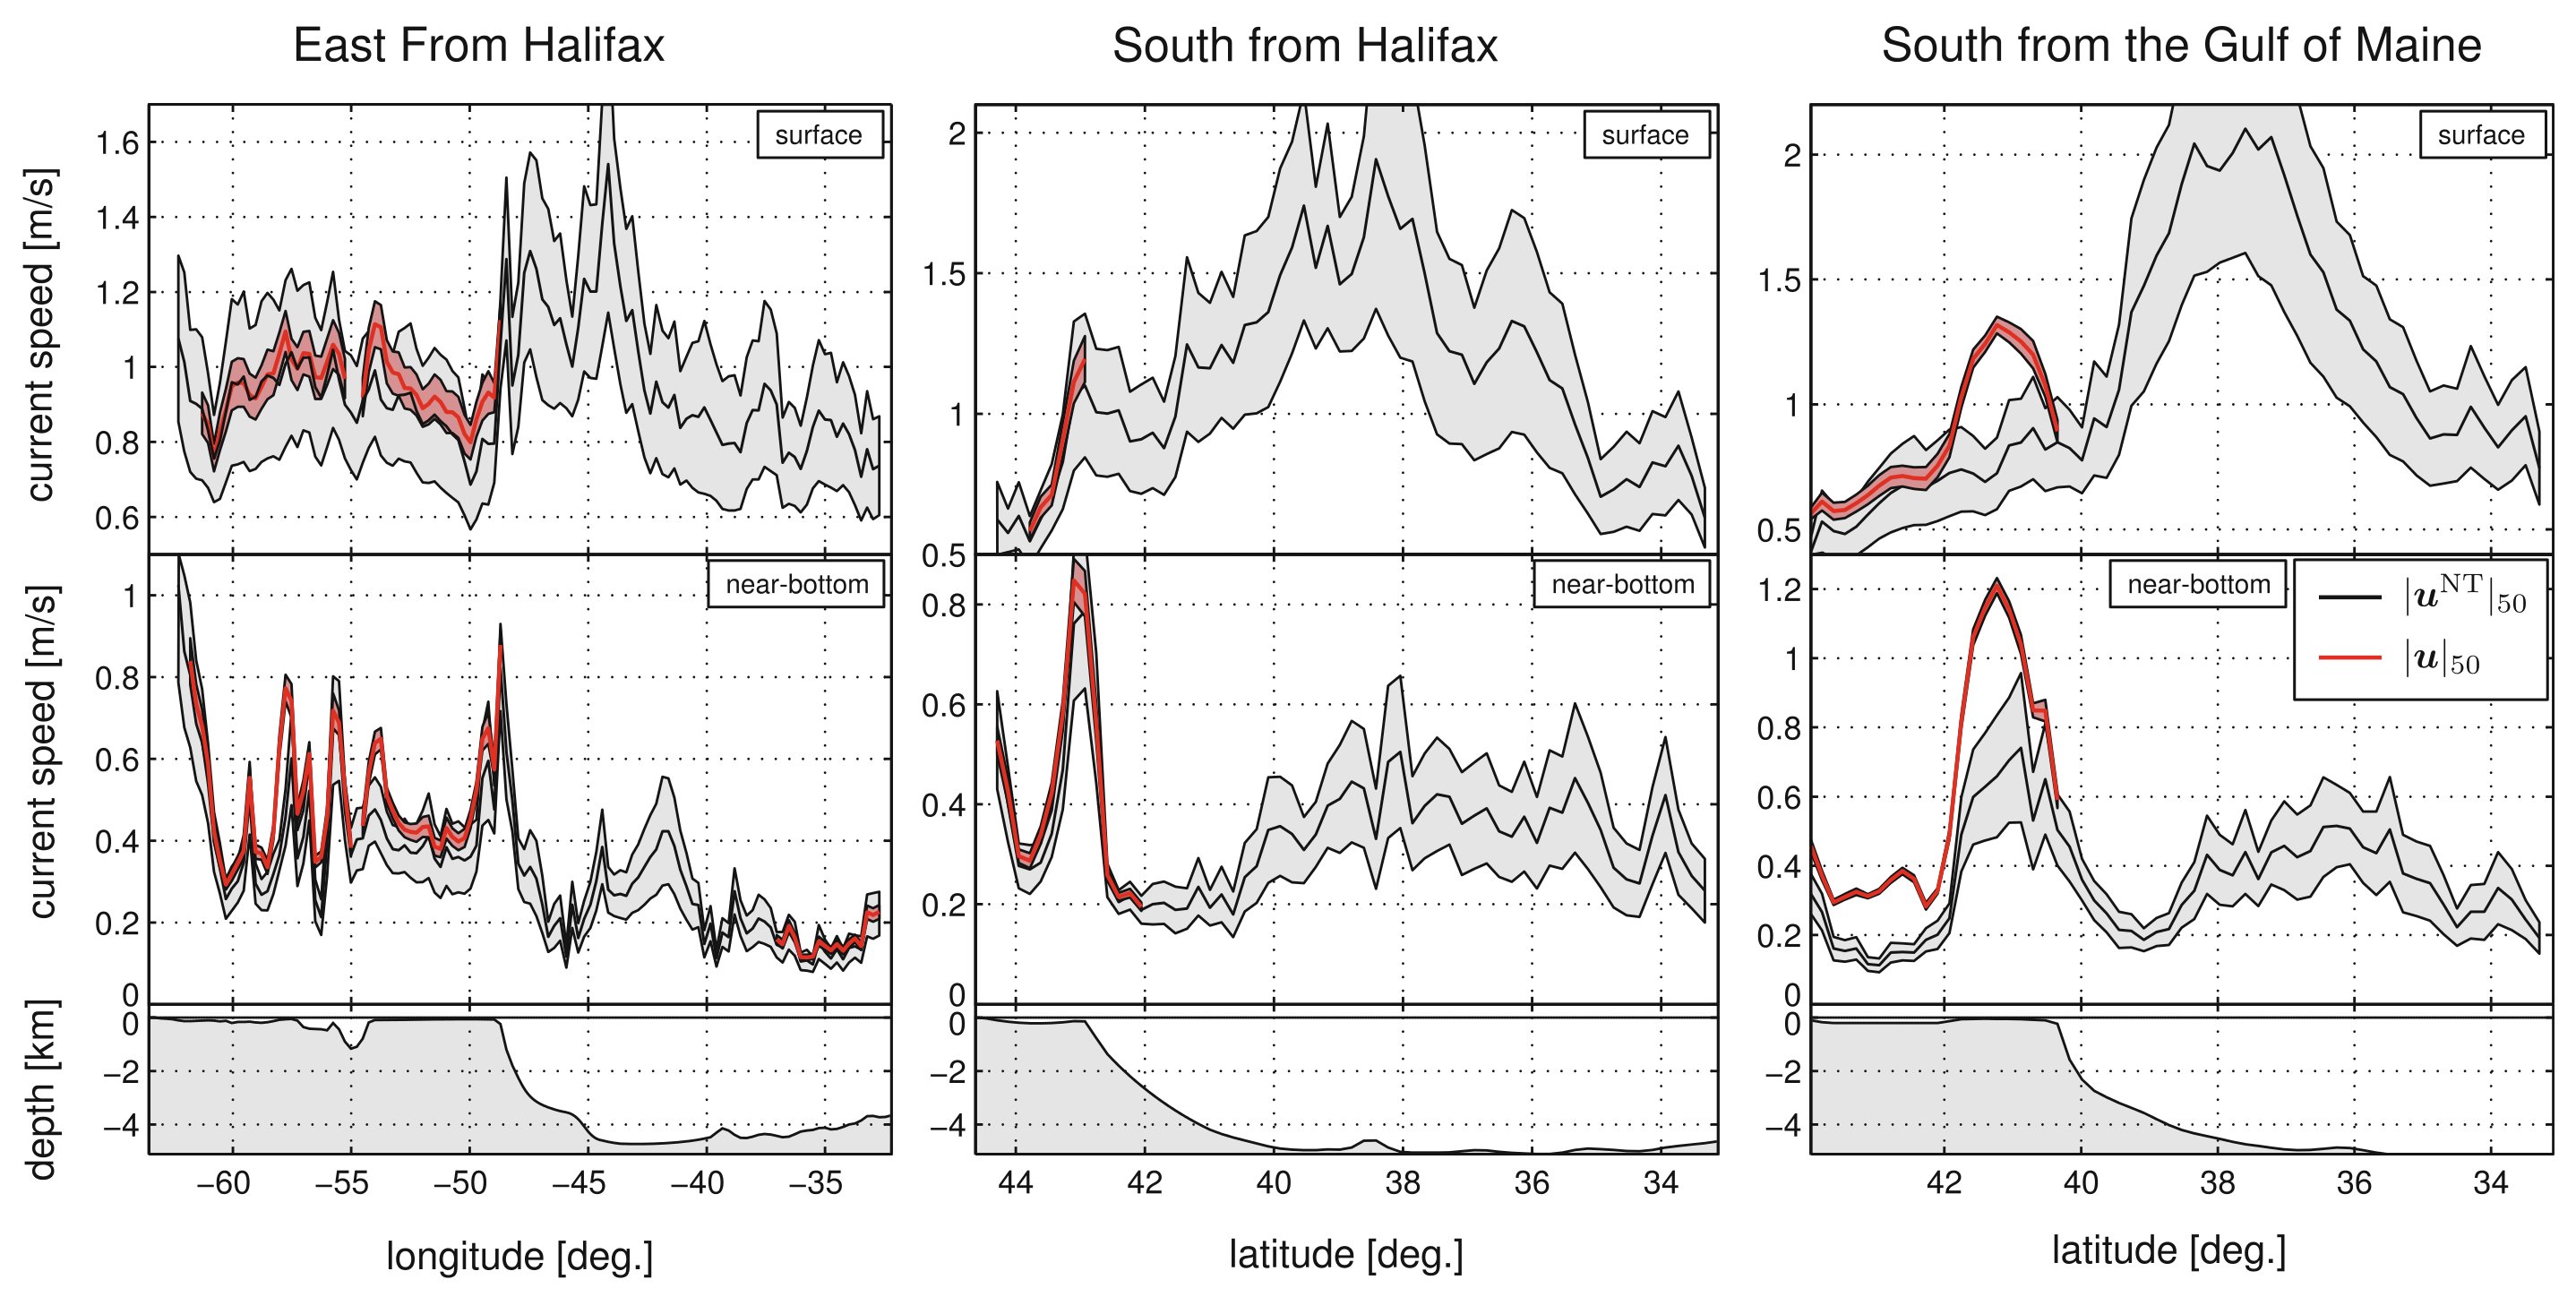
Figure 2: Extreme currents along several transects with a return period of 50 years. The transects run east from Halifax (left), south from Halifax (center), and south from the Gulf of Maine (right). The 50-year extreme current speeds for the non-tidal component (black lines) and the total (tidal and non-tidal together, red lines) are shown at the surface (top panels) and near the bottom (middle panels). The extreme values for the total are only shown for regions where the standard deviation of tidal currents is at least one-third of the standard deviation of non-tidal currents. Shaded areas indicate the 95% confidence intervals. The bathymetry along each transect is shown in the bottom panels. (click image for hi-res version.)
|
d