|
Probability of extreme Boreal Summer rainfall over australia was calculated based on MJO phase using the Wheeler and Hendon (2004) index and the historical reconstruction over the shared period (1979-2008) and the pre-1979 period over which data is available (1950-1978 and 1905-1949). All MJO events of amplitude less than one were ignored. 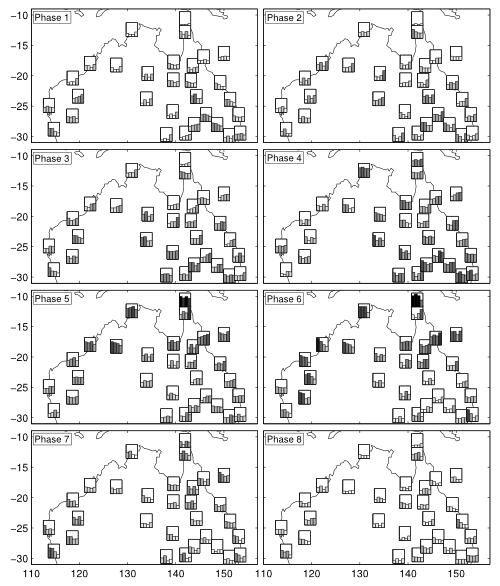
Figure 1: The location of each bar plot represents the station location where rainfall data were available. The vertical axis of each bar plot represents the probability of weekly DJF rainfall in the highest quintile for that station, conditioned on MJO phase (the range of each bar plot is from 0 to ß0.45 except 0.6 for the northernmost station, Booby Island). The hading level of each bar is proportional to its height. The first bar in each bar plot is the result using the Wheeler and Hendon (2004) index over 1979 to 2008, the second bar is the reconstructed index over 1979 to 2008, the third bar is the reconstructed index over 1950 to 1978, and the fourth bar is the reconstructed index over 1905 to 1949. |