|
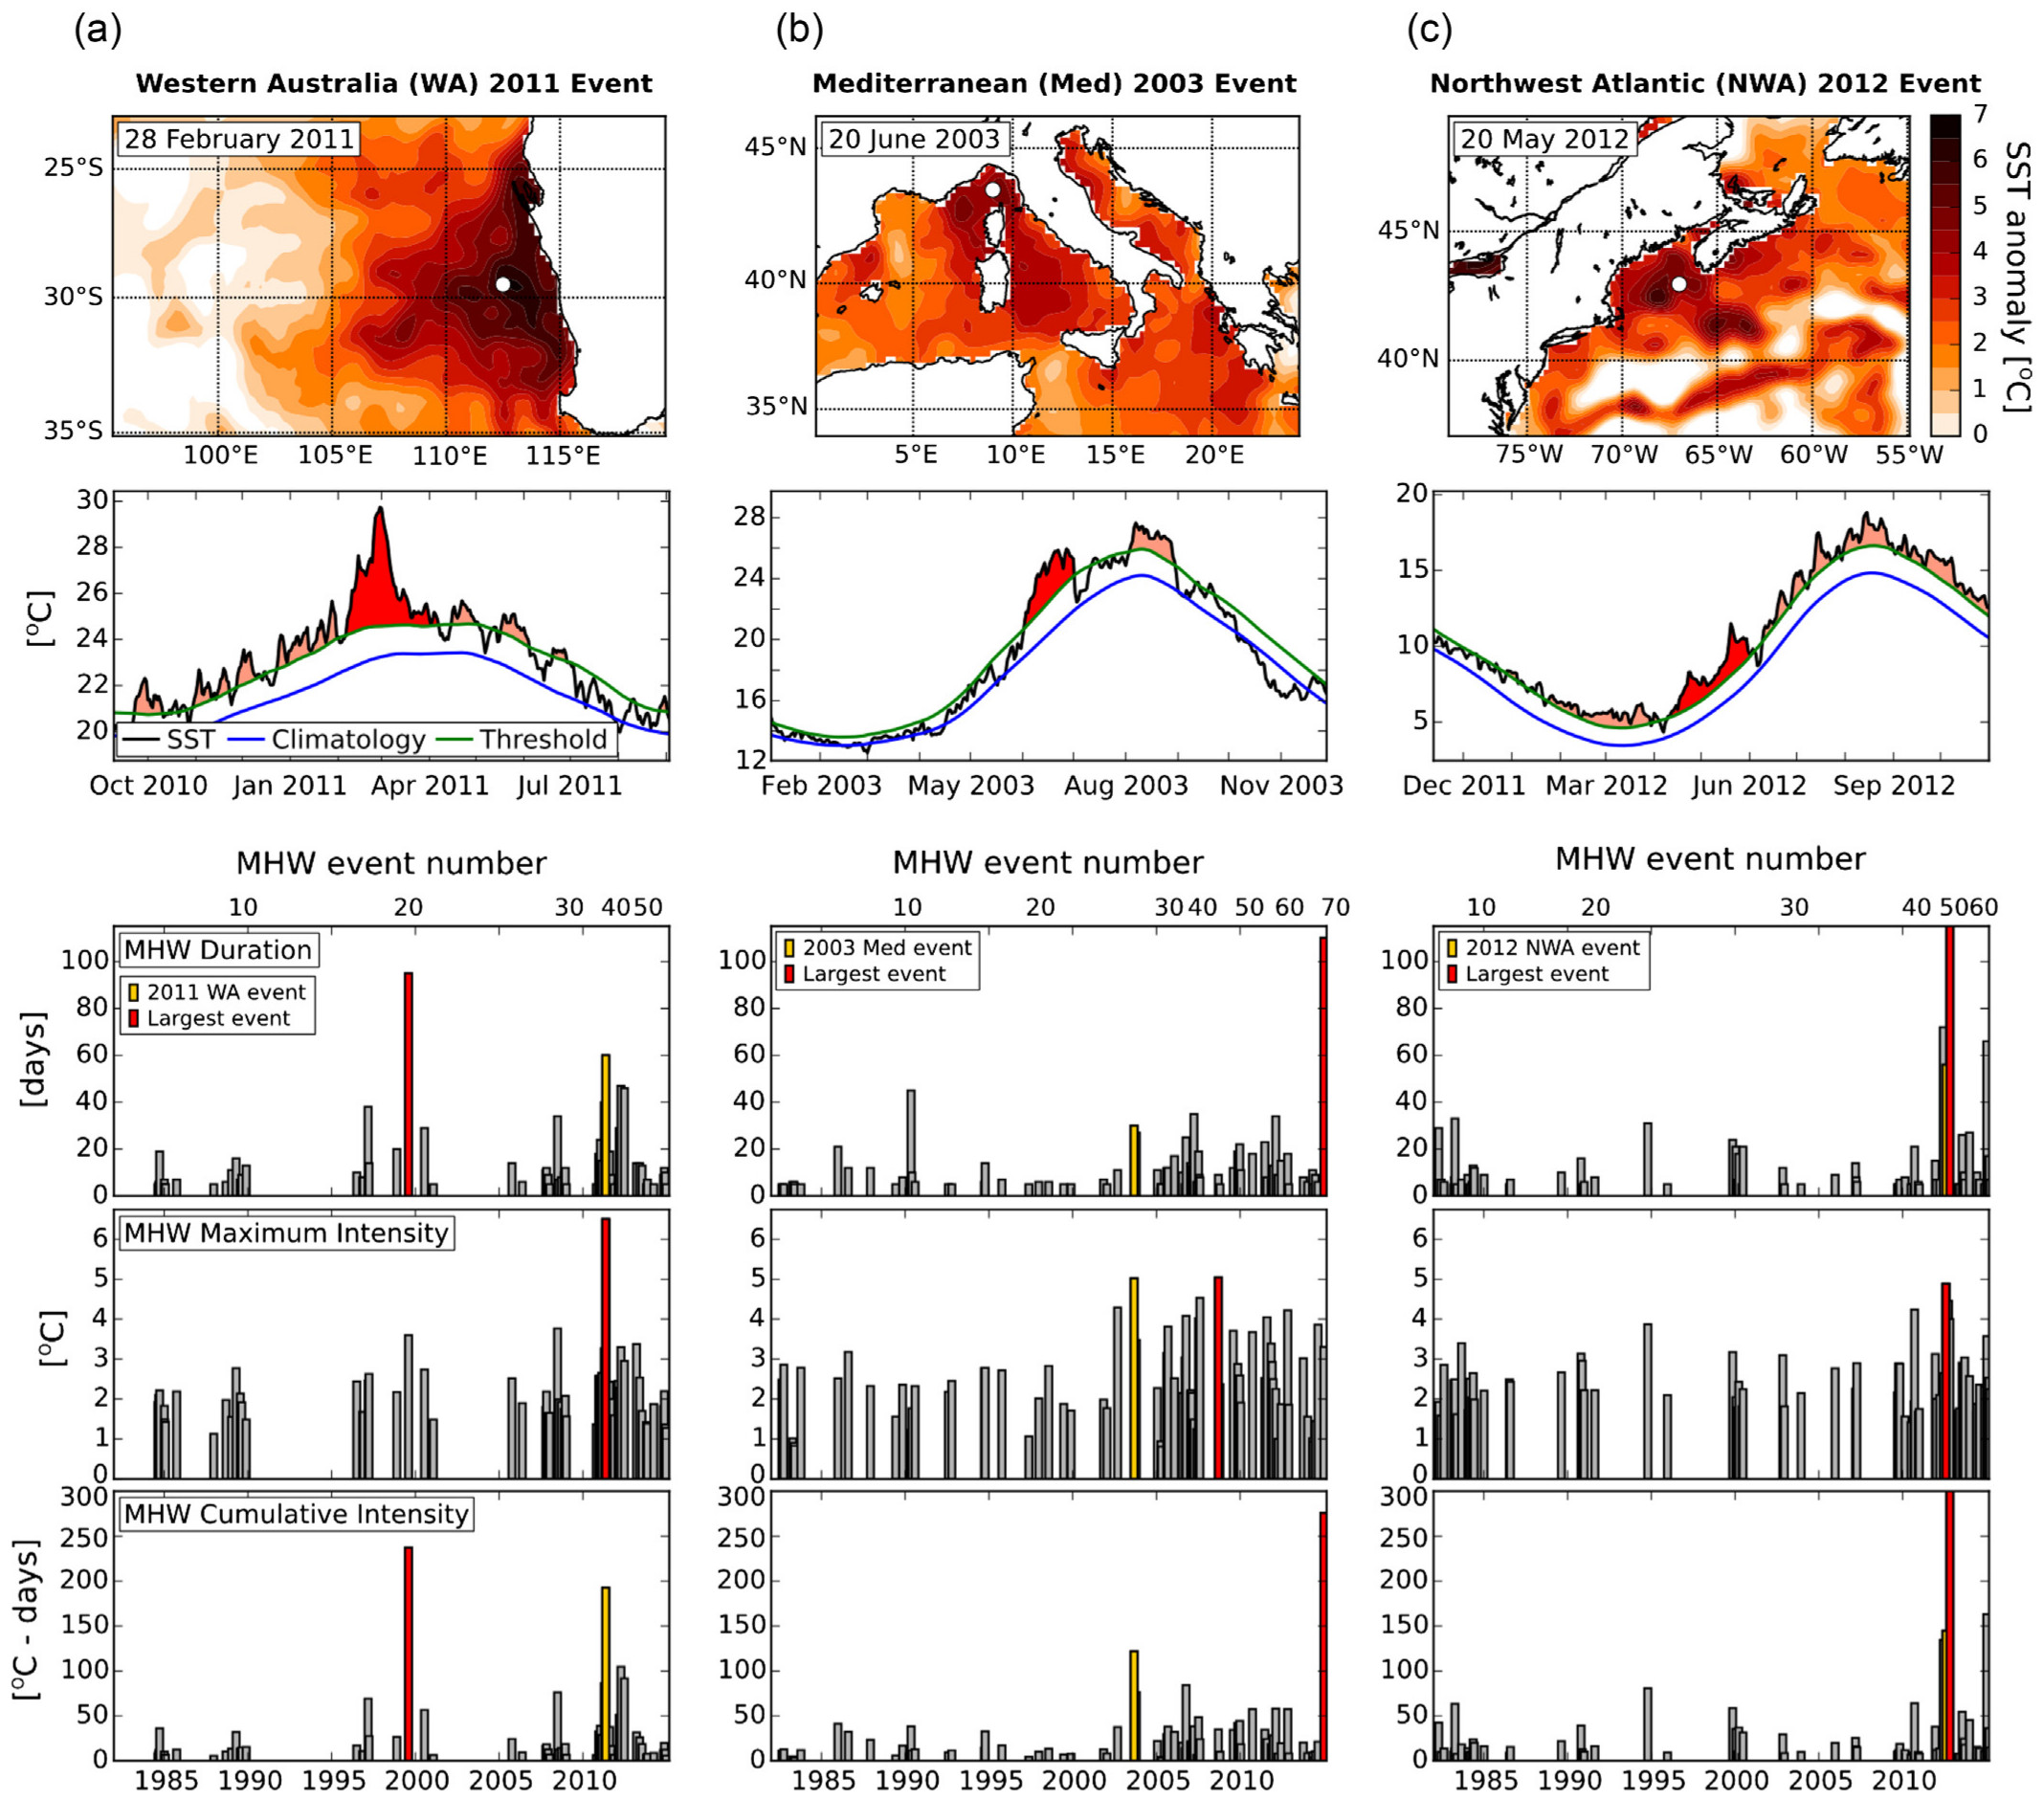
Marine heatwaves (MHWs) have been defined by Hobday et al. (Prog Ocean, 2016) as discrete prolonged anomalously warm water events. These events have be devastating for regional ecosystems with economic impacts on fisheries, aquaculture, and tourism. I have been and am currently involved in a number of studies on MHWs including their definition, physical drivers and processes, spatial patterns and long-term trends, as well as regional studies including around Tasmania and South Africa. A hierarchical approach to defining marine heatwaves (Hobday et al., Progress in Oceanography, 2016) Abstract: Marine heatwaves (MHWs) have been observed around the world and are expected to increase in intensity and frequency under anthropogenic climate change. A variety of impacts have been associated with these anomalous events, including shifts in species ranges, local extinctions and economic impacts on seafood industries through declines in important fishery species and impacts on aquaculture. Extreme temperatures are increasingly seen as important influences on biological systems, yet a consistent definition of MHWs does not exist. A clear definition will facilitate retrospective comparisons between MHWs, enabling the synthesis and a mechanistic understanding of the role of MHWs in marine ecosystems. Building on research into atmospheric heatwaves, we propose both a general and specific definition for MHWs, based on a hierarchy of metrics that allow for different data sets to be used in identifying MHWs. We generally define a MHW as a prolonged discrete anomalously warm water event that can be described by its duration, intensity, rate of evolution, and spatial extent. Specifically, we consider an anomalously warm event to be a MHW if it lasts for five or more days, with temperatures warmer than the 90th percentile based on a 30-year historical baseline period. This structure provides flexibility with regard to the description of MHWs and transparency in communicating MHWs to a general audience. The use of these metrics is illustrated for three 21st century MHWs; the northern Mediterranean event in 2003, the Western Australia ‘Ningaloo Niño’ in 2011, and the northwest Atlantic event in 2012. We recommend a specific quantitative definition for MHWs to facilitate global comparisons and to advance our understanding of these phenomena.
|