|
Predictability of the Madden–Julian Oscillation index: seasonality and dependence on MJO phase (Oliver and Thompson, Climate Dynamics, 2016) Abstract: We describe here a damped harmonic oscillator model for the Wheeler and Hendon (Mon Weather Rev 132(8):1917–1932, 2004) Madden–Julian Oscillation (MJO) index in order to gain new insights into the predictability of the MJO. Building on a tradition of idealized models, the model for the MJO state consists of a bivariate autoregressive process, equivalent to a finite difference approximation to a dynamical underdamped harmonic oscillator, as represented by a second order ordinary differential equation. The statistical properties of the model, namely the ensemble mean, ensemble variance, and within-ensemble correlation, are used to develop predictability time scales for canonical MJO events. We explore the model under both white noise and coloured noise forcing and the model parameters are estimated using maximum likelihood estimation, as a function of season and initial MJO event amplitude and phase. The model provides a significantly better fit using coloured noise forcing, which is equivalent to using a higher order model, indicating that the MJO index is not a simple order-1 coupled autoregressive process. Using the fitted model we map the predictability times scales for the mean, variance, and correlation as a function of initial MJO position in phase space. It is shown that the predictability time scales, and thus MJO predictability, vary as a function of MJO phase space and season which is a novel result for empirical models of the MJO. The result that MJO predictability varies with MJO state also has relevance for the interpretation of the Maritime Continent prediction barrier. 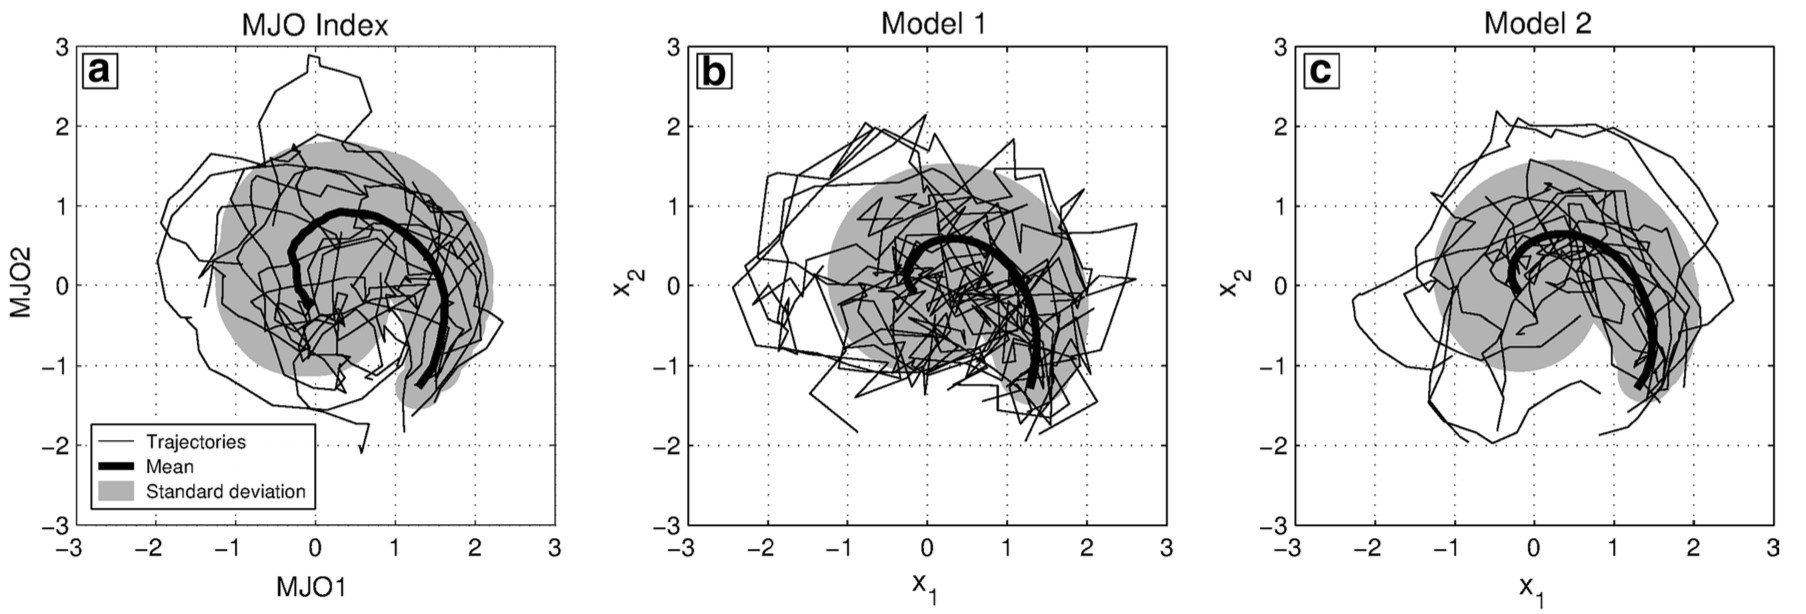 Figure 1: Evolution of the statistics of an ensemble of MJO events. (a) The statistical properties of a 4000-member ensemble of MJO events with an initial observation at ( 2, − 2) and with error variance = 0.1 are shown for the following 35 days. The statistical properties of (b) Model 1 and (c) Model 2. The thick black line shows the mean, the shaded area shows the standard deviation about this mean, and the thin lines show 20 representative trajectories. |