|
Global Response The relationship between the Madden-Julian Oscillation (MJO) and global sea level is mapped in Figure 1. Regions with a strong MJO-sea level connection include the Equatorial Pacific Ocean, west coast of the Americas, Gulf of Carpentaria (northern Australia), and the northeastern Indian Ocean [Oliver and Thompson, Journal of Geophysical Research, 2010].
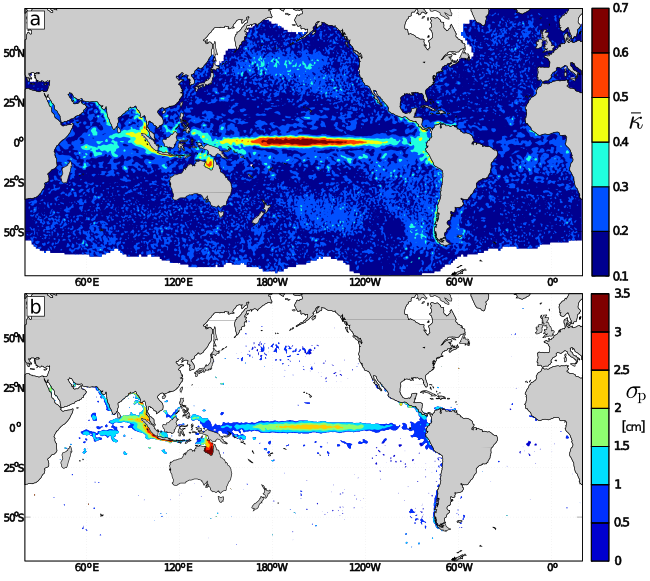
Figure 1: Global maps of the amount of sea level variability related to the MJO. (a) The proportion of standard deviation of sea level which can be accounted for, statistically, by the MJO index. (b) The standard deviation of sea level which is accounted for by the MJO index (white areas are below the 5% significance level).
Equatorial Pacific and Coastal Americas Propagation of sea level on intraseasonal time scales, which is coherent with the MJO, along the Equatorial Pacific and west coast of the Americas is shown in Figure 2. There is clear, coherent eastward propagation along the Equatorial waveguide followed by poleward propagation, both North and South, along the Americas (the coastal waveguide of the eastern Pacific) [Oliver and Thompson, Journal of Geophysical Research, 2010].
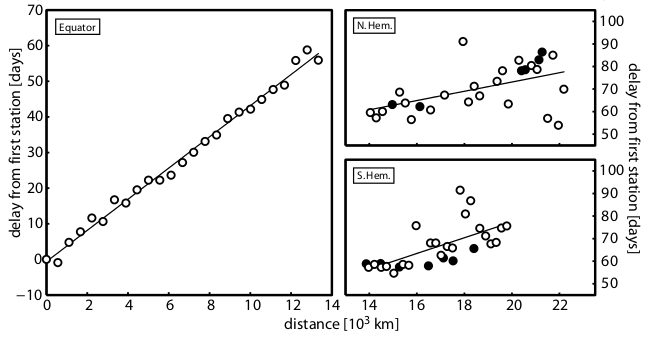
Figure 2: The first frequency-dependent empirical orthogonal function mode, at a an oscillation period of 75 days, of sea level showing continuous propagation eastward along the (left) Equatorial Pacific and then (right) poleward along west coast of the Americas in both hemispheres. Open circles show data from altimeter measurement locations; filled circles show tide gauge data.
Gulf of Carpentaria Intraseasonally varying wind forcing during the Australian monsoon, related to the MJO, forces sea level and circulation variability in the Gulf of Carpentaria. Wind direction is oriented in such away that it lines up nearly perfectly with the the axis of maximum response, due to basin geomettry, of sea level set-up. A fully-nonlinear, barotropic ocean model was used to map the distribution of MJO-related sea level and depth-averaged circulation in the Gulf (Figure 3) [Oliver and Thompson, Journal of Geophysical Research, 2011].
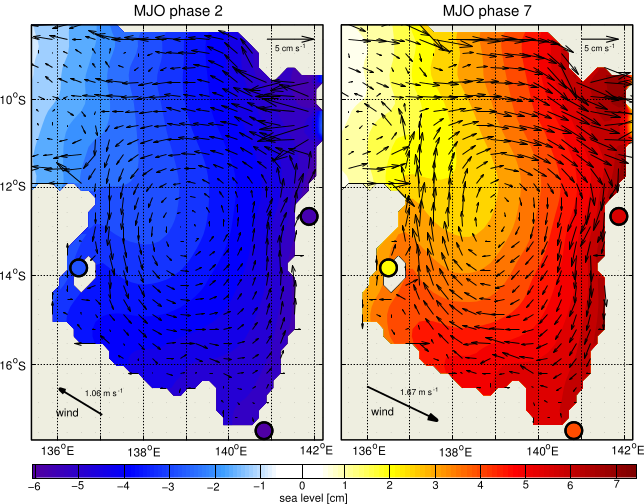
Figure 3: Composite of wind, sea level and circulation anomalies associated with (left) phase 2 and (right) phase 7 of the MJO. The wind (arrow, lower left) is derived from reanalysis; sea level (coloured circles) show tide gauge data; sea level (coloured contours) and circulation (arrows) in the interior of the Gulf are from the barotropic ocean model.
Gulf of Thailand A very similar phenomenon occurs in the Gulf of Thailand, during the Asian monsoon (Figure 4) [Oliver, Climate Dynamics, 2012].
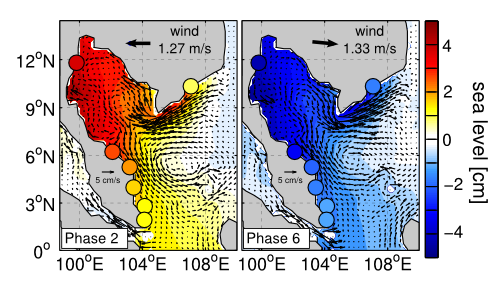
Figure 4: Same format as Figure 3, for the Gulf of Thailand.
Northeastern Indian Ocean Composites of sea level in the northeastern Indian Ocean show a complex set of dynamics (Figure 5). There is clear eastward propagation along the Equator which, upon reaching Sumatra, splits into two poleward-propagating coastally-trapped waves: one southward along Sumatra and Java, and one northward which continues counterclockwise around the Bay of Bengal. Furthermore, there is some reflection of the sea level signal originating near the northern tip of Sumatra, leading to a westward propagating wave along 5.5 degrees N back into the interior of the Indian Ocean [Oliver, Ph. D. thesis].
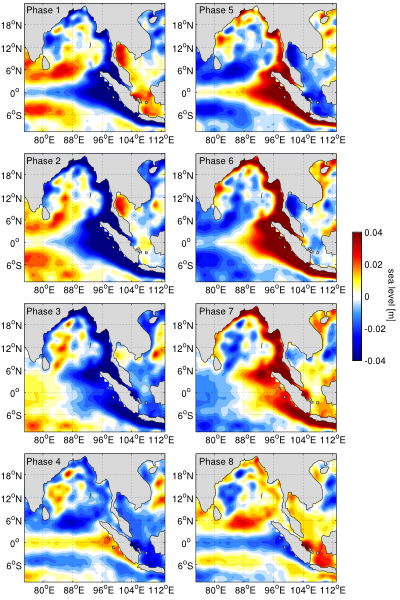
Figure 5: Composites of altimeter-derived sea level anomalies with the eight phases of the MJO.
Other Regions Other regions of interest which may exhibit a strong MJO-sea level signal, and may be worthy of further examination, include the upwelling system off the west coast of Chile, the western boundary of the Tropical Pacific Ocean, and the upwelling system off the north coasts of Colombia and Venezuela.
|