|
The MJO index of Wheeler and Hendon (2004) has been reconstructed over the period 1/1/1905 to 31/12/2008. This reconstruction was generated by multiple linear regression of surface pressure time series, from the Twentieth Century Reanalysis (20CR), at 12 locations onto the Wheeler and Hendon (2004) index (Oliver and Thompson, Journal of Climate, 2012, pdf).
- Daily values of the reconstructed index are available for download:
- The locations from which Twentieth Century Reanalysis pressure series were taken are shown by white circles:
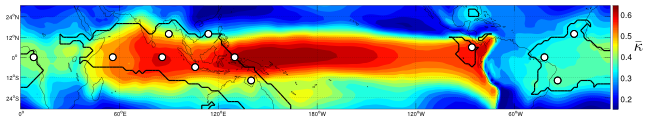
Exact locations, along with regression coefficients, are given in the table below. The regression coefficients were calculated by least-squares linear regression of the Wheeler and Hendon (2004) index onto the bandpassed pressure series over the 1979 to 2008 period.
| Location | Longitude (oE) | Latitude (oN) | β1 | β1,H | β2 | β2,H
|
|---|
| 1 | 106 | -6 | 1.97 | -2.37 | 2.13 | 1.53
| | 2 | 86 | 0 | 0.511 | -1.09 | 2.52 | 0.442
| | 3 | 326 | -14 | 1.21 | -0.117 | 0.452 | 0.713
| | 4 | 114 | 14 | -0.655 | 0.723 | -1.09 | 0.713
| | 5 | 336 | 14 | 0.55 | -0.509 | -0.108 | -0.424
| | 6 | 56 | 0 | 0.451 | 0.107 | 0.924 | 1.12
| | 7 | 90 | 14 | -1.29 | 0.0302 | -0.427 | -0.945
| | 8 | 140 | -14 | -0.729 | 0.153 | -1.72 | -0.48
| | 9 | 318 | 0 | 0.506 | 0.359 | -0.188 | 0.92
| | 10 | 274 | 6 | -1.54 | 2.08 | -2.34 | -1.82
| | 11 | 8 | 0 | 1.2 | 1.34 | -1.82 | 0.225
| | 12 | 130 | 0 | -2.87 | -0.777 | 2.09 | -2.74 |
The reconstructed index, IHR, is generated by linear combination of bandpassed pressure series, p, and their Hilbert transforms, pH:
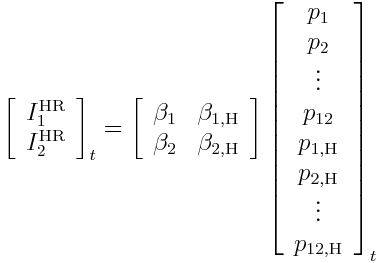
where t is a time index and the β are 1 x 12 row vectors with values given in the table above.
- Extensive validation of the reconstructed index over the pre-1979 period was performed. For example, the connection between the MJO and various environmental variables has been calculated using the Wheeler and Hendon (2004) index and the reconstructed index over various time periods:
- Furthermore, studies have begun using the reconstructed index to examine the stability or multidecadal variability of known MJO connections over the twentieth century:
- Through the development of this index it was found that great care must be taken when using reanalysed surfaced pressures from 20CR. By arbitrarily choosing predictor locations one can control the long-term trend in MJO amplitude between approximately zero and an increase of 30%.
|